Trigonometry — Core Graphics — Xcode iOS — Part-2

In the first part, we have seen all about the trigonometric functions with applied Unit Circle theories and understand the importance of trigonometry for Core Graphics.
Now let’s go for apply that all in Xcode with core graphics. We will see all about how core graphics is generating different wave patterns with trigonometric functions on a graph.
Get the full Xcode project from this link — https://github.com/Dhaval1094/DUTrigonomatery-SineCos
Let’s generate sine and cosine waves exactly like what we have seen with Core Graphics sin() and cos() functions in the previous part. It will look like this.

As we know sine is starting from 0˚, and the compliment of sine, Cosine is starting from 90˚ as in the above image. These both are toggling just with the below line code.

Both functions are just changing their values and we are getting exactly perfect sine and cos wave patterns. Look in the below simulator recording.
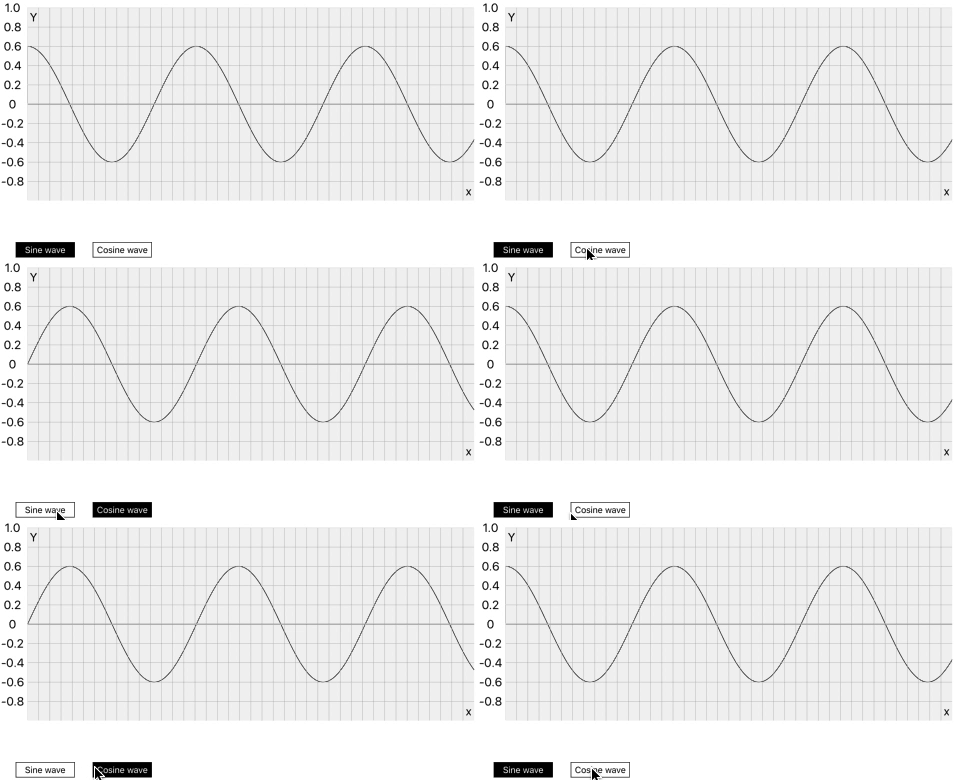
Let’s experiment on the relationship between the Unit circle and core graphics.
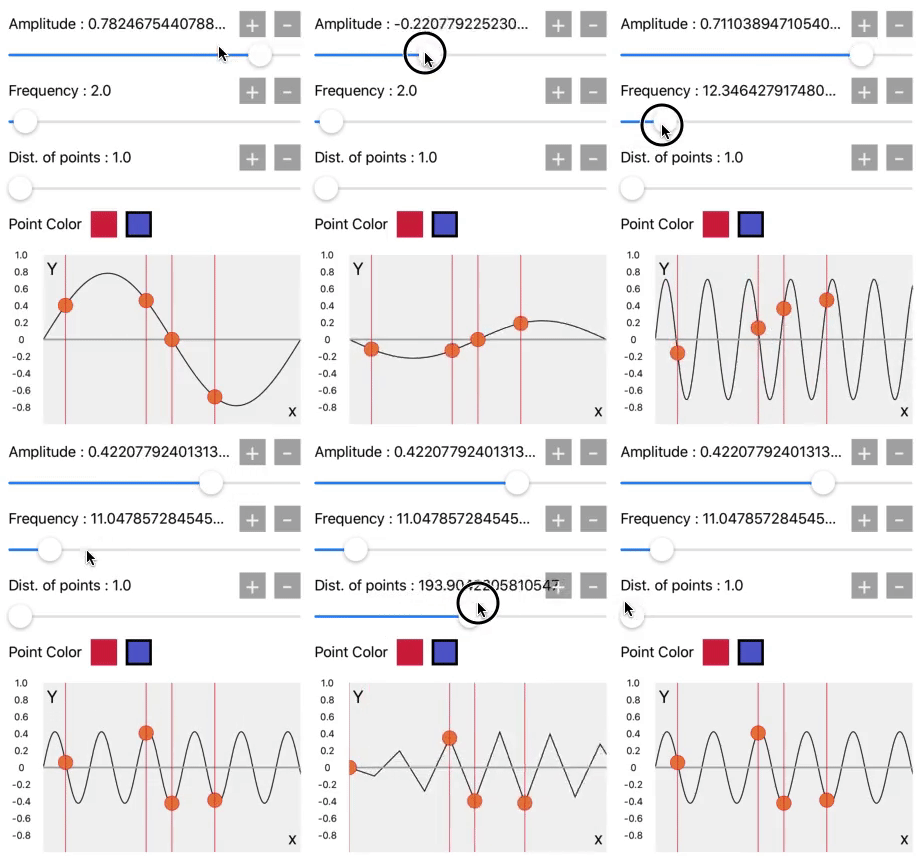
Here the amplitude will be change between 1.0 and -1.0 by amplitude slider. When amplitude will be 1.0, it means Y=1.0 it will become a value of sin(90˚), and the wave exactly at 90˚ is on the pick amplitude. As that’s our first quadrant of the unit circle.
Then there is frequency slider. It means the speed of unwrapping unit circle, or we can say the speed of oscillation or the number of rotations will be increased.
Means if the frequency =1 for 1 second, which means the unit circle rotates 1 cycle in a second. And when frequency = 2 for 1 second, then the unit circle rotates 2 cycles in a second.
The third slider is the distance between points. It is at 1.0 on the starting value. That’s why we get this sine wave pattern. But when we increase it its also generating square, triangular and other waves. We will see it later.
Let’s see how these three are working.
In code, we used all 360 degrees on the x-axis for one unit circle cycle. So, we can plot 360 points for one cycle. We can joint all 360 points, which will create an accurate sine wave for 1 cycle.
Like in the below image, there are 90 points between 0˚ to 90˚, there are 360 points (CGPoints) between 0˚ to 360˚. By joining this all points we will get below pattern with complete 1 unit circle cycle. For drawing this plane and jointing the points we used UIBezierPath.
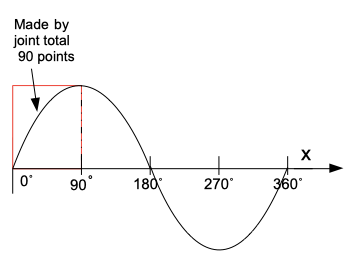
After completion of this, we will run another cycle for another 360˚. Means 360˚ + 360˚ = 720˚, so there are a total of 720 CGPoints that will joint and made 2 sine cycles, this process will continuos with for loop as per frequency value. Means if we increase the frequency the number of points will be increased. The numbers of wave cycles appearing on the graph are dependent on frequency.
So, first, we have to get how many cycles we have to draw on the graph, we have to define the frequency and the graph width. Same as in the below function.
First for loop is for defining how many wave cycles we want to generate with given graph width. Another loop is for showing distance between two points means if we divide the circle in 360 degrees we have to joint 360 points. If we will keep 180 distance between points, it means there are 180 points in a wave cycle, that we have to joint for getting the wave pattern, and so on.
Then draw just baseline with the use of UIBezierPath, for indicating x plane on the graph.
Now in the func addSineWaveIn(rect: CGRect) in the first for loop, we are defining each wave cycle origin point.
Y will remain constant as it has to start from the baseline on the graph. So we keep it height * 0.5. The freqCycle is the origin.x on the graph for each new wave cycle. As x plane define degrees, each new cycle will start from sin(0˚, 360˚, 720˚…..) or cos(0˚, 360˚, 720˚…..).
let origin = CGPoint(x: freqCycle, y: height * 0.5)
Now in the inner for loop, in the below line we are getting the radian value of the degree, denoted by Ø for applying in sin(ø) or cos(ø) functions. We have to convert that radian to a degree by the following formula because generally programming languages use radians instead of degrees, as well as in core graphics.
let Ø = (degree/180.0 * .pi), where ø is unknown angle
Then we got both x and y value for a particular point from the unit circle. That will be the same point P at the circle for that degree in our code.
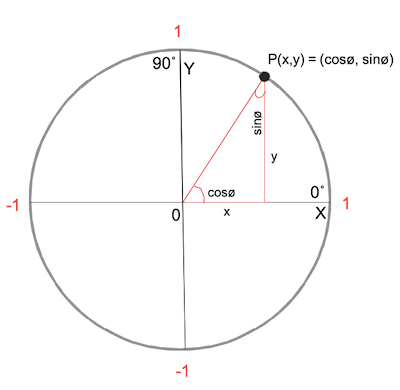
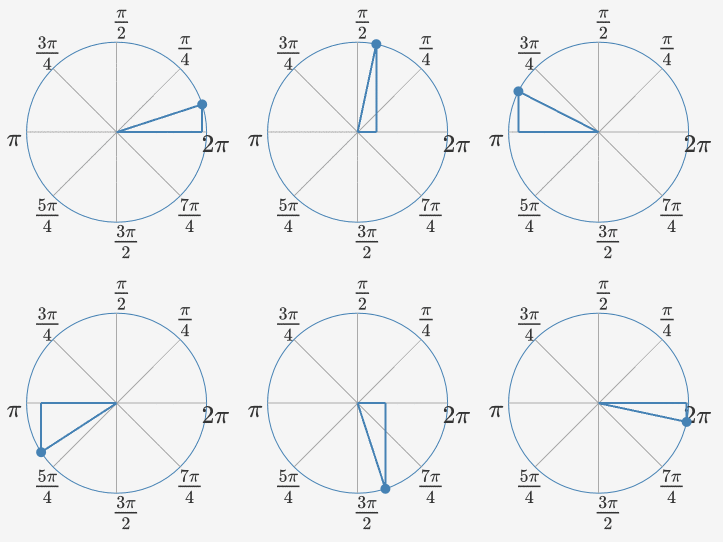
So with point P in a triangle, we got values for x and y for all 360 degrees. Then make an object of CGPoint with the below x and y, and then all 360 CGPoints with UIBaziers path we will get the wave pattern.
let x = CGFloat(degree/(180 * frequency)) * width
let y = origin.y — CGFloat(y_plot) * height * CGFloat(amplitude)
Now we have these 6 following functions of trigonometry, which we will apply for getting specific wave patterns.
sin, cos, tan, cot, sec, cosec
When we select sin, cos, tan, cot, sec, or cosec from the segment control we will get the wave pattern accordingly.
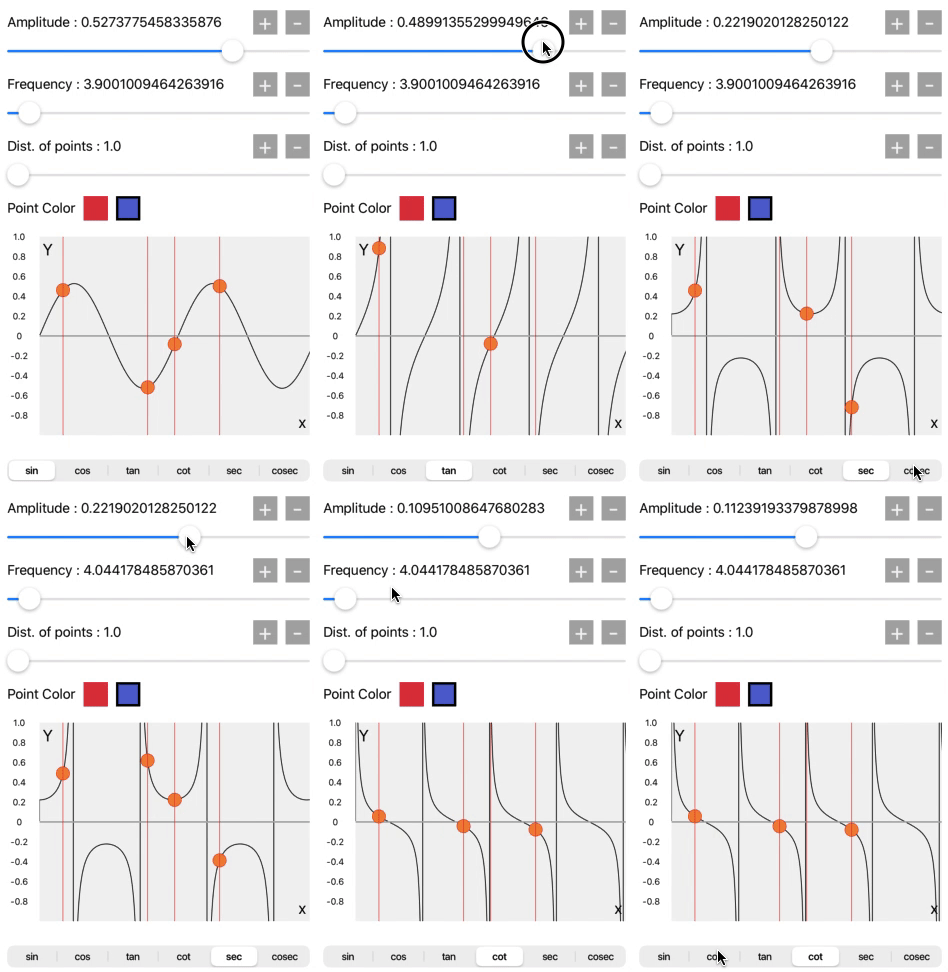
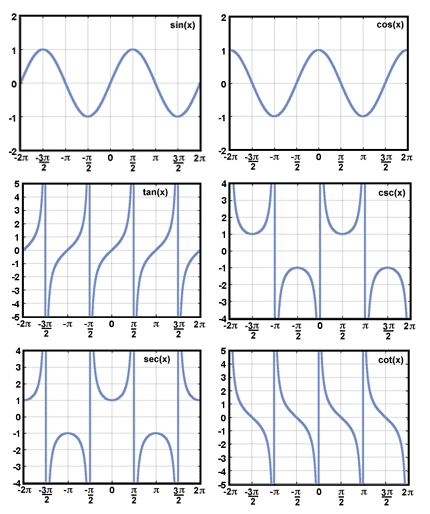
These all waves are accurately generated with the trigonometric functions in the core graphics. Compare the wave pattern with the above image.
Now for the experiment, for getting the specific value of the wave, there is on red and blue color buttons. Select the color from the buttons and select any point on the wave which will give, all details of a selected point on the wave and explain the relationship between the unit circle and the point location on the wave.
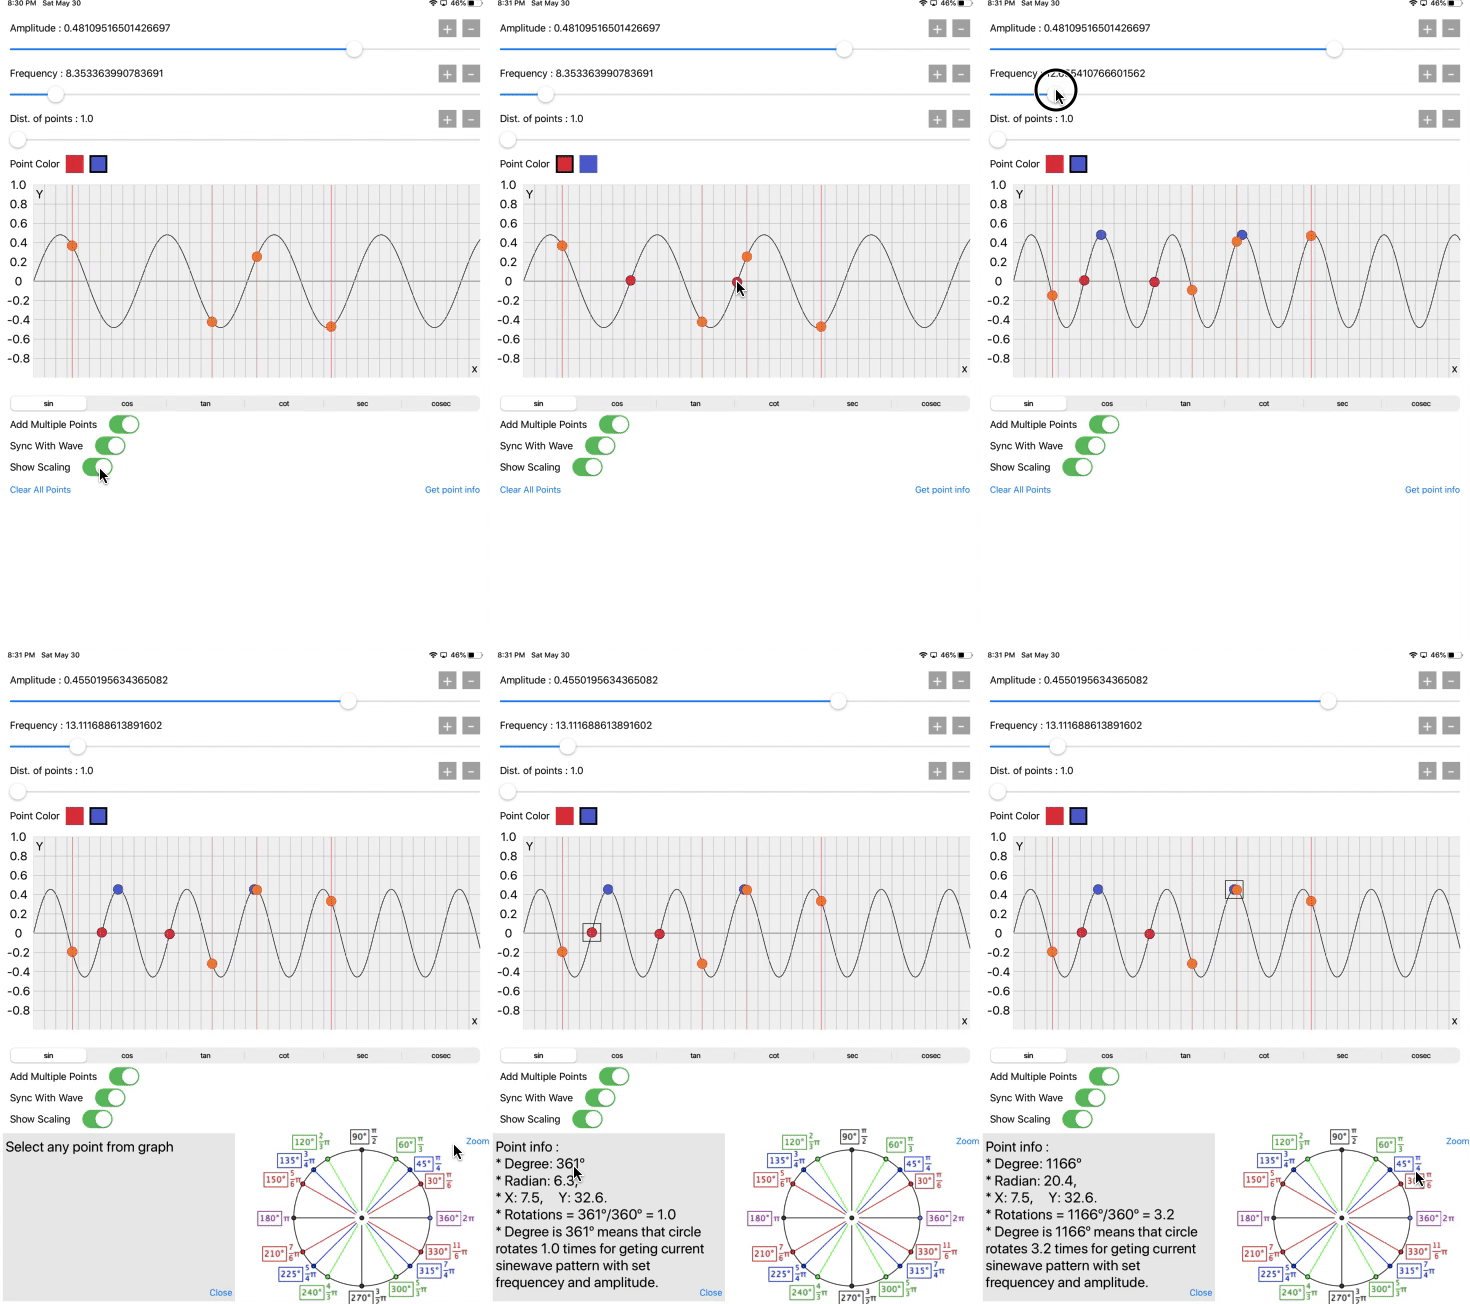
Now just look the crazy patterns generate when we add the high value of frequency. In physics, there is it’s called Amplitude Modulation, which we are showing in below screen recording. That describes how efficiently and accurately the core graphics operation is working.
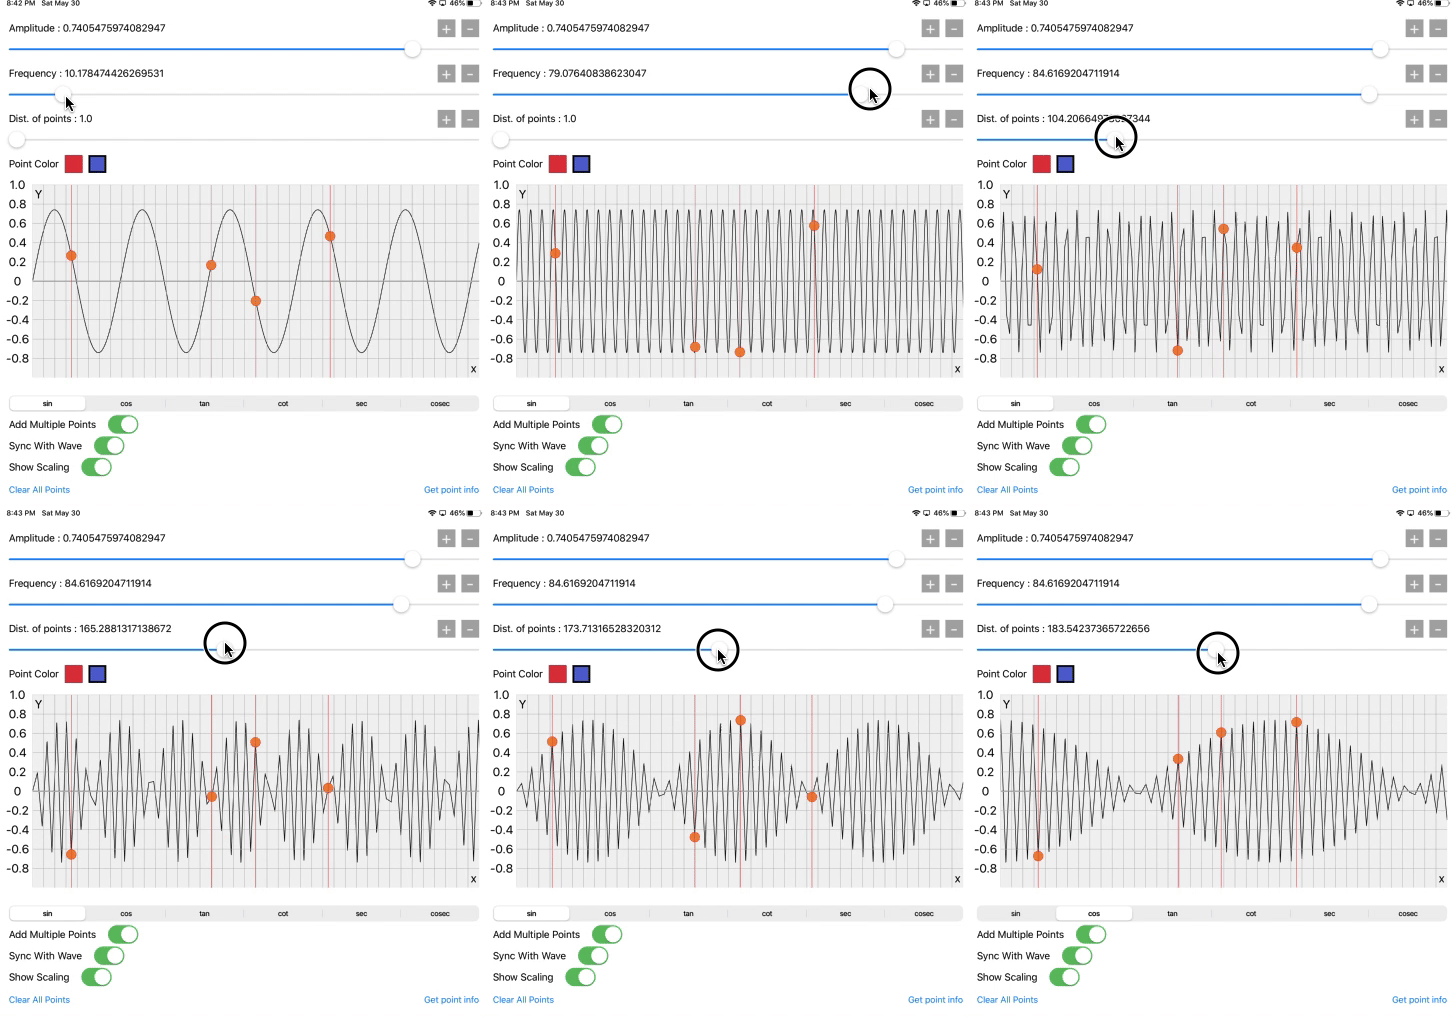
You can just compare the pattern with the below animation.
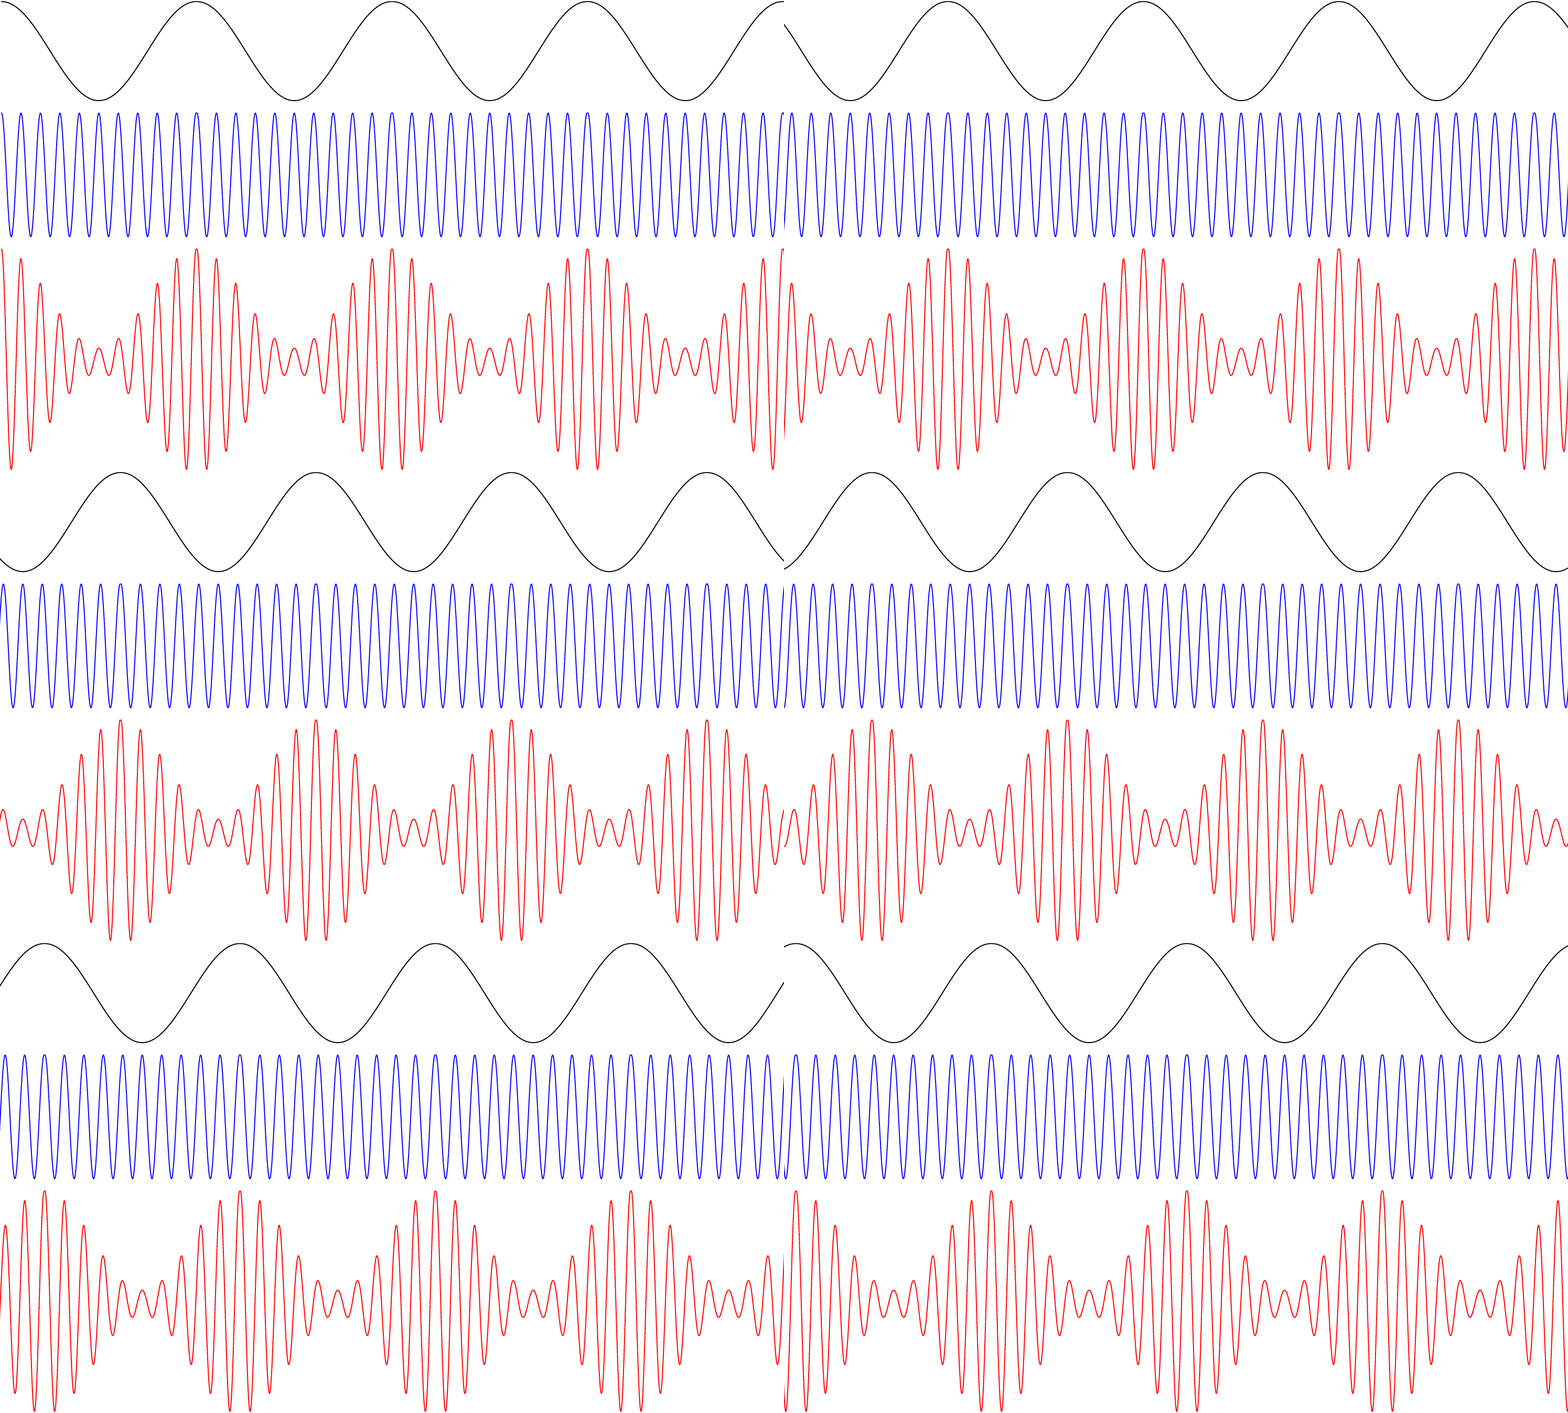
I got this GIF from this site — http://acousticslab.org/RECA220/PMFiles/Module02a.htm.
Just look at the images and animations by clicking this site. Don’t read others if getting bored, but I recommend to just see the wave animations and images, it will be fun. And core graphics is able to do all the things mentioned on this website.
Get the full Xcode project for this experiment with this git hub link. https://github.com/Dhaval1094/DUTrigonomatery-SineCos
Now I have one lesson regarding the trigonometry and core graphics.
Draw the pie chart with use of sin, cos with the coregraphics. 🙃
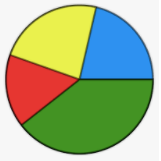
Let me know in the comments if you have any ideas 😉.
Thanks for reading this article!!
Feel free to ask any questions.
